|  |
 |
|
 |
| |
Internet Traffic Report
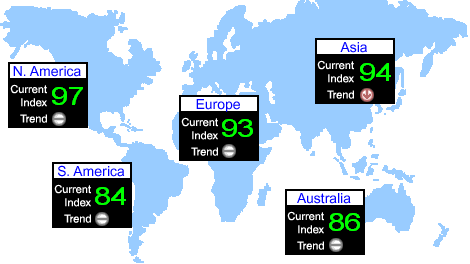
The Internet Traffic Report monitors the flow of data around the world. It then displays a value between zero and 100. Higher values indicate faster and more reliable connections.


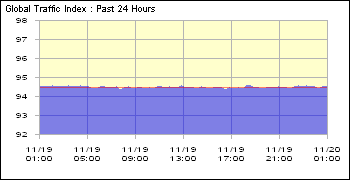
The "Traffic Index" is a score from 0 to 100 where 0 is "slow" and 100 is "fast". It is determined by comparing the current response of a ping echo to all previous responses from the same router over the past 7 days. A score of 0 to 100 is then assigned to the current response depending on if this response is better or worse than all previous responses from that router.
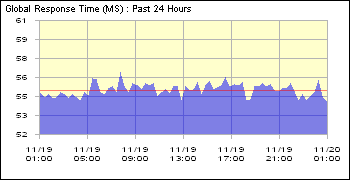
Response Time in reference to Internet traffic is how long it takes for a chunk of data to travel from point A to point B and back (round trip). A typical response time on the Internet is 200 ms, which is 200 milliseconds (thousandths of a second) = 1/5th of one second.
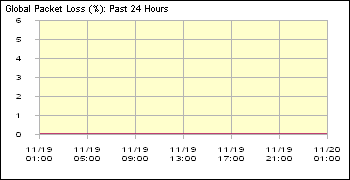
Packet Loss measures the reliability of a connection. A known chunk of data is sent to the router and then the router is supposed to send the same data back unaltered (echo). In the case of something like ping, several packets are sent out over the course of a couple seconds. So, if 10 packets were sent out, but only 8 made it back, then that would be 20% packet loss; so the more packets that are sent, the more accurate the picture of what the actual packet loss is. In a perfect world 0% packet loss is what we all want - every packet we send out makes it to where it's supposed to go. In reality, some packet loss is probably going to happen, but as long as it is under 5% or so you shouldn't even notice. So just remember that the higher the packet loss percentage, the slower the connection will work because in most instances it has to send the same piece of information several times.
Statistics Provided By InternetTrafficReport.Com

|
|
 |
|
 |
|


